Go deeper than a running total
A P&L number tells you if you're up. It doesn't tell you whether your edge is real, where it's concentrated, or what a bad month actually looked like. note500's Reports suite does — profit factor, expectancy, R-multiples, drawdown and your fattest tails — the numbers that separate a real edge from a hot streak.
Try note500 free →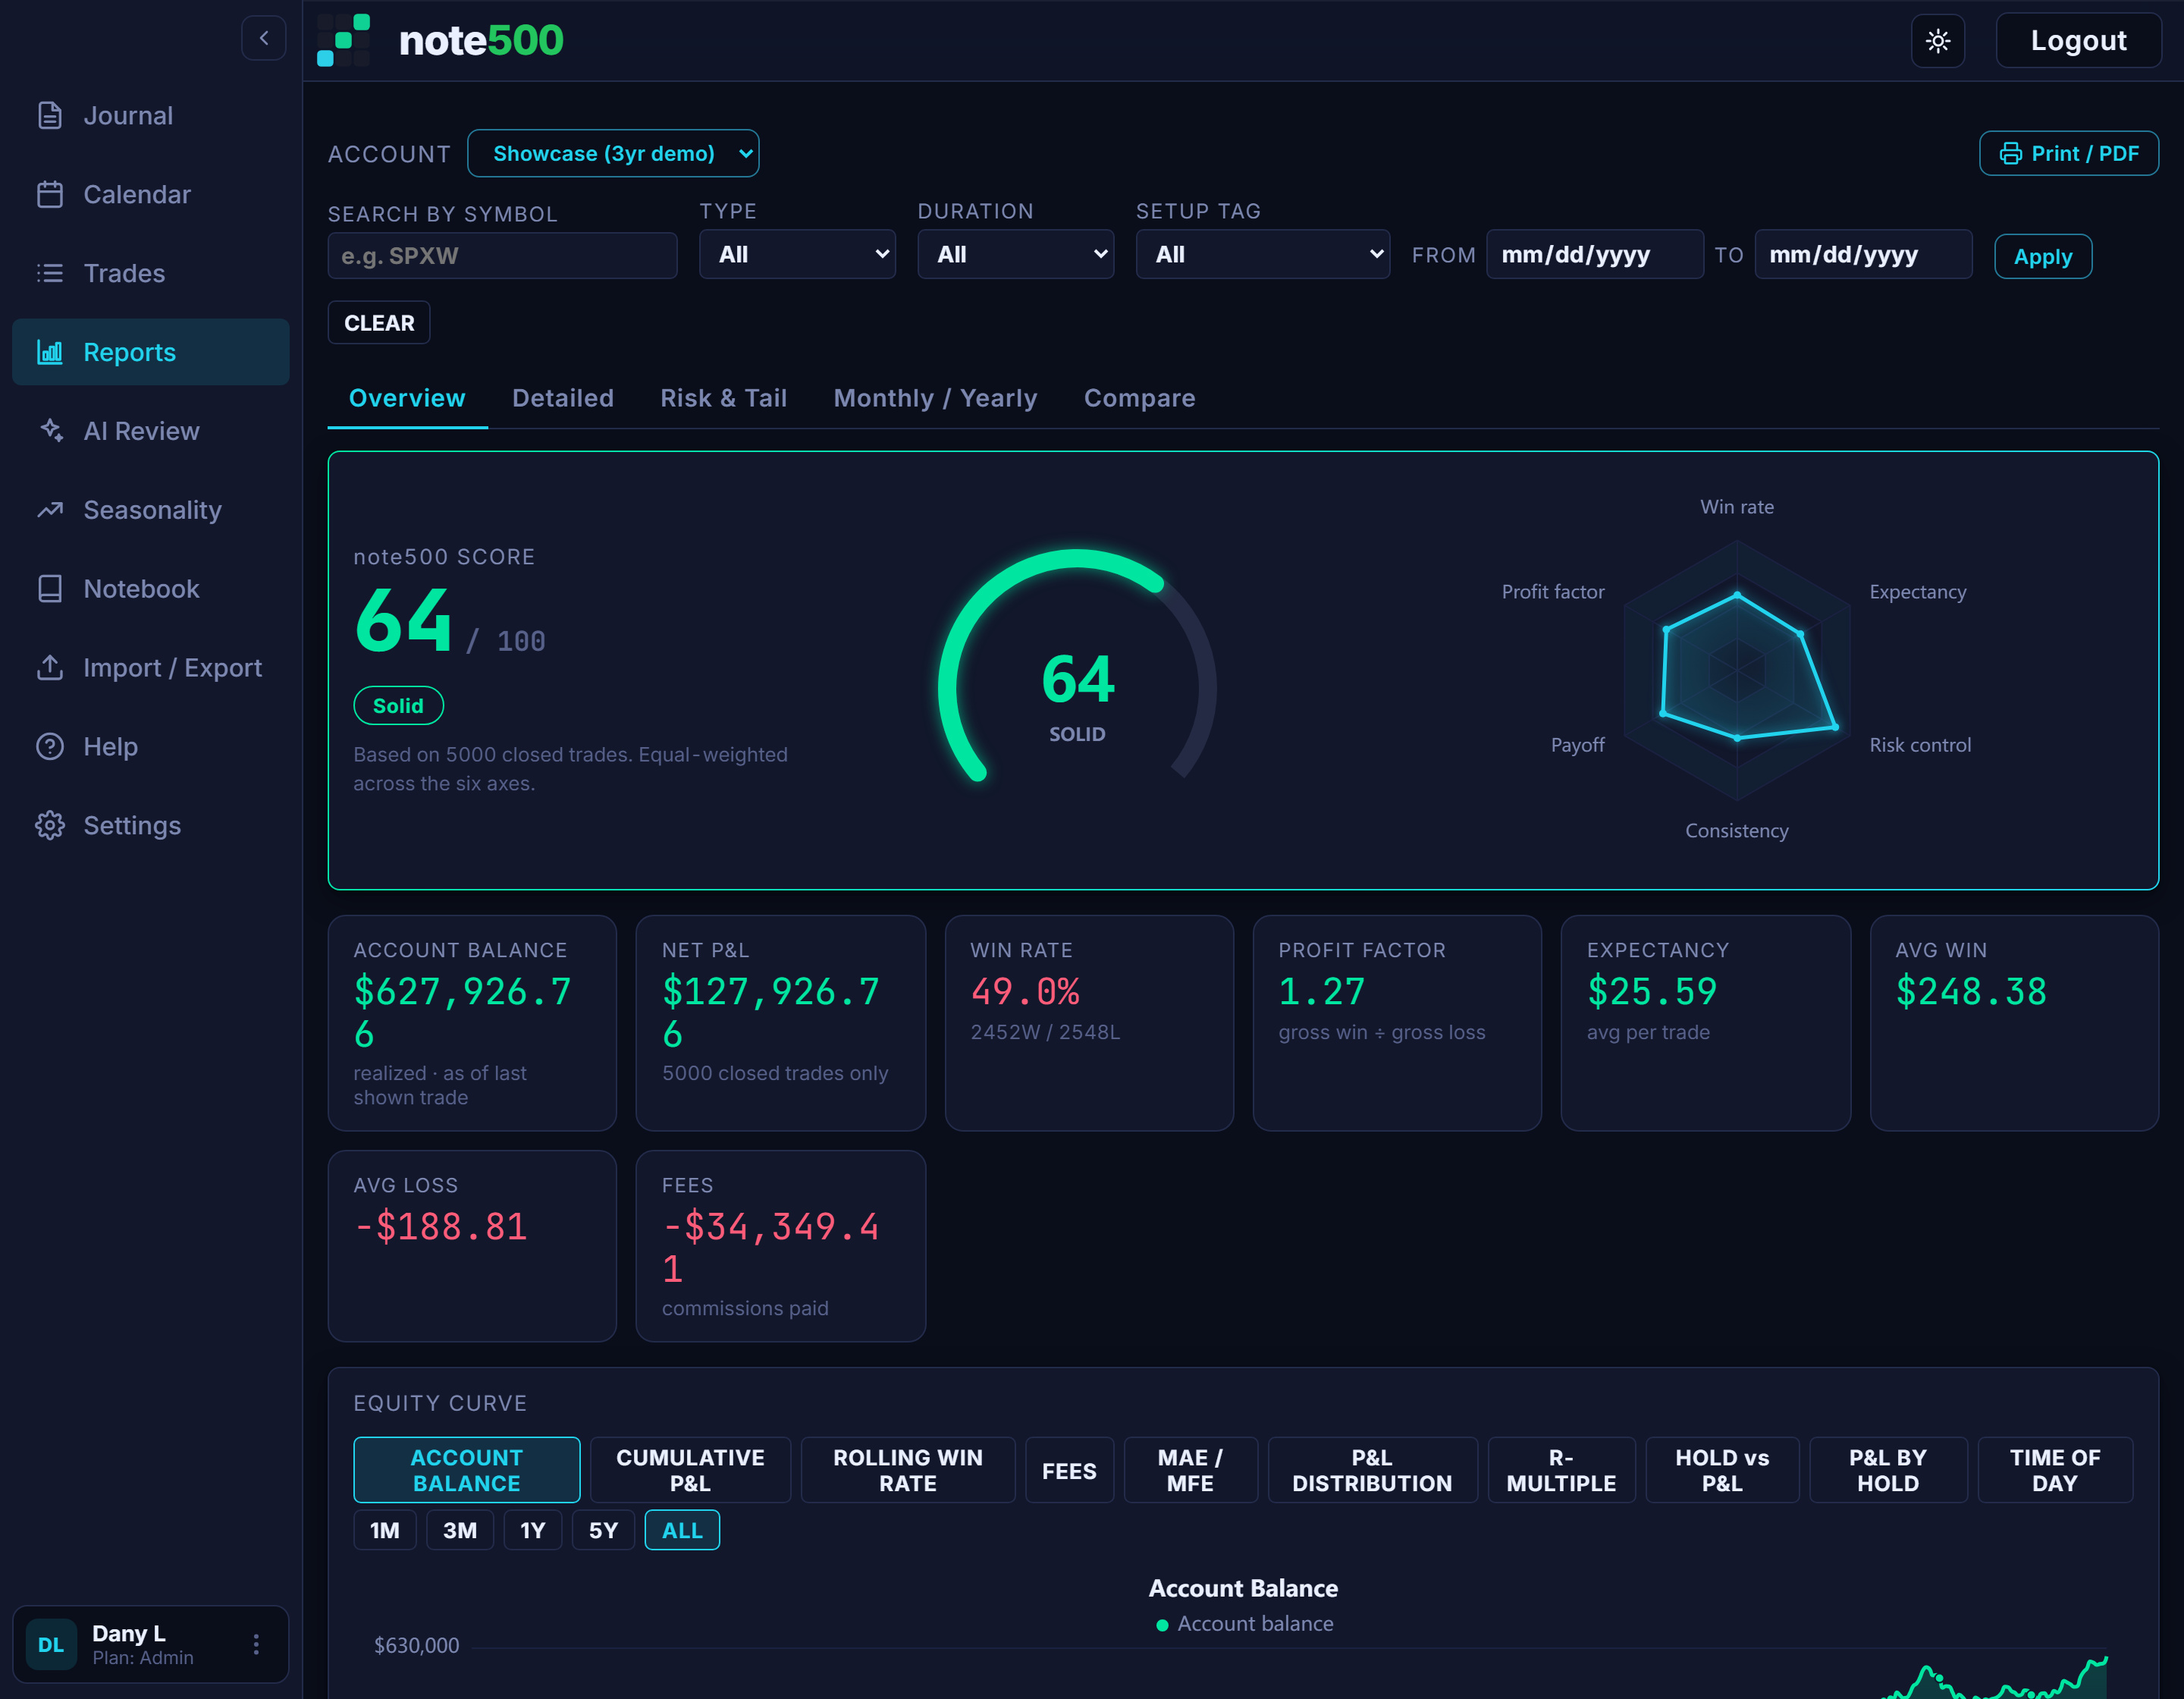
Four reports, one story
Overview
Net P&L, win rate, profit factor, expectancy, average win vs loss — over an equity curve you can flip to account balance, rolling win rate or fees, across any timeframe.
Detailed
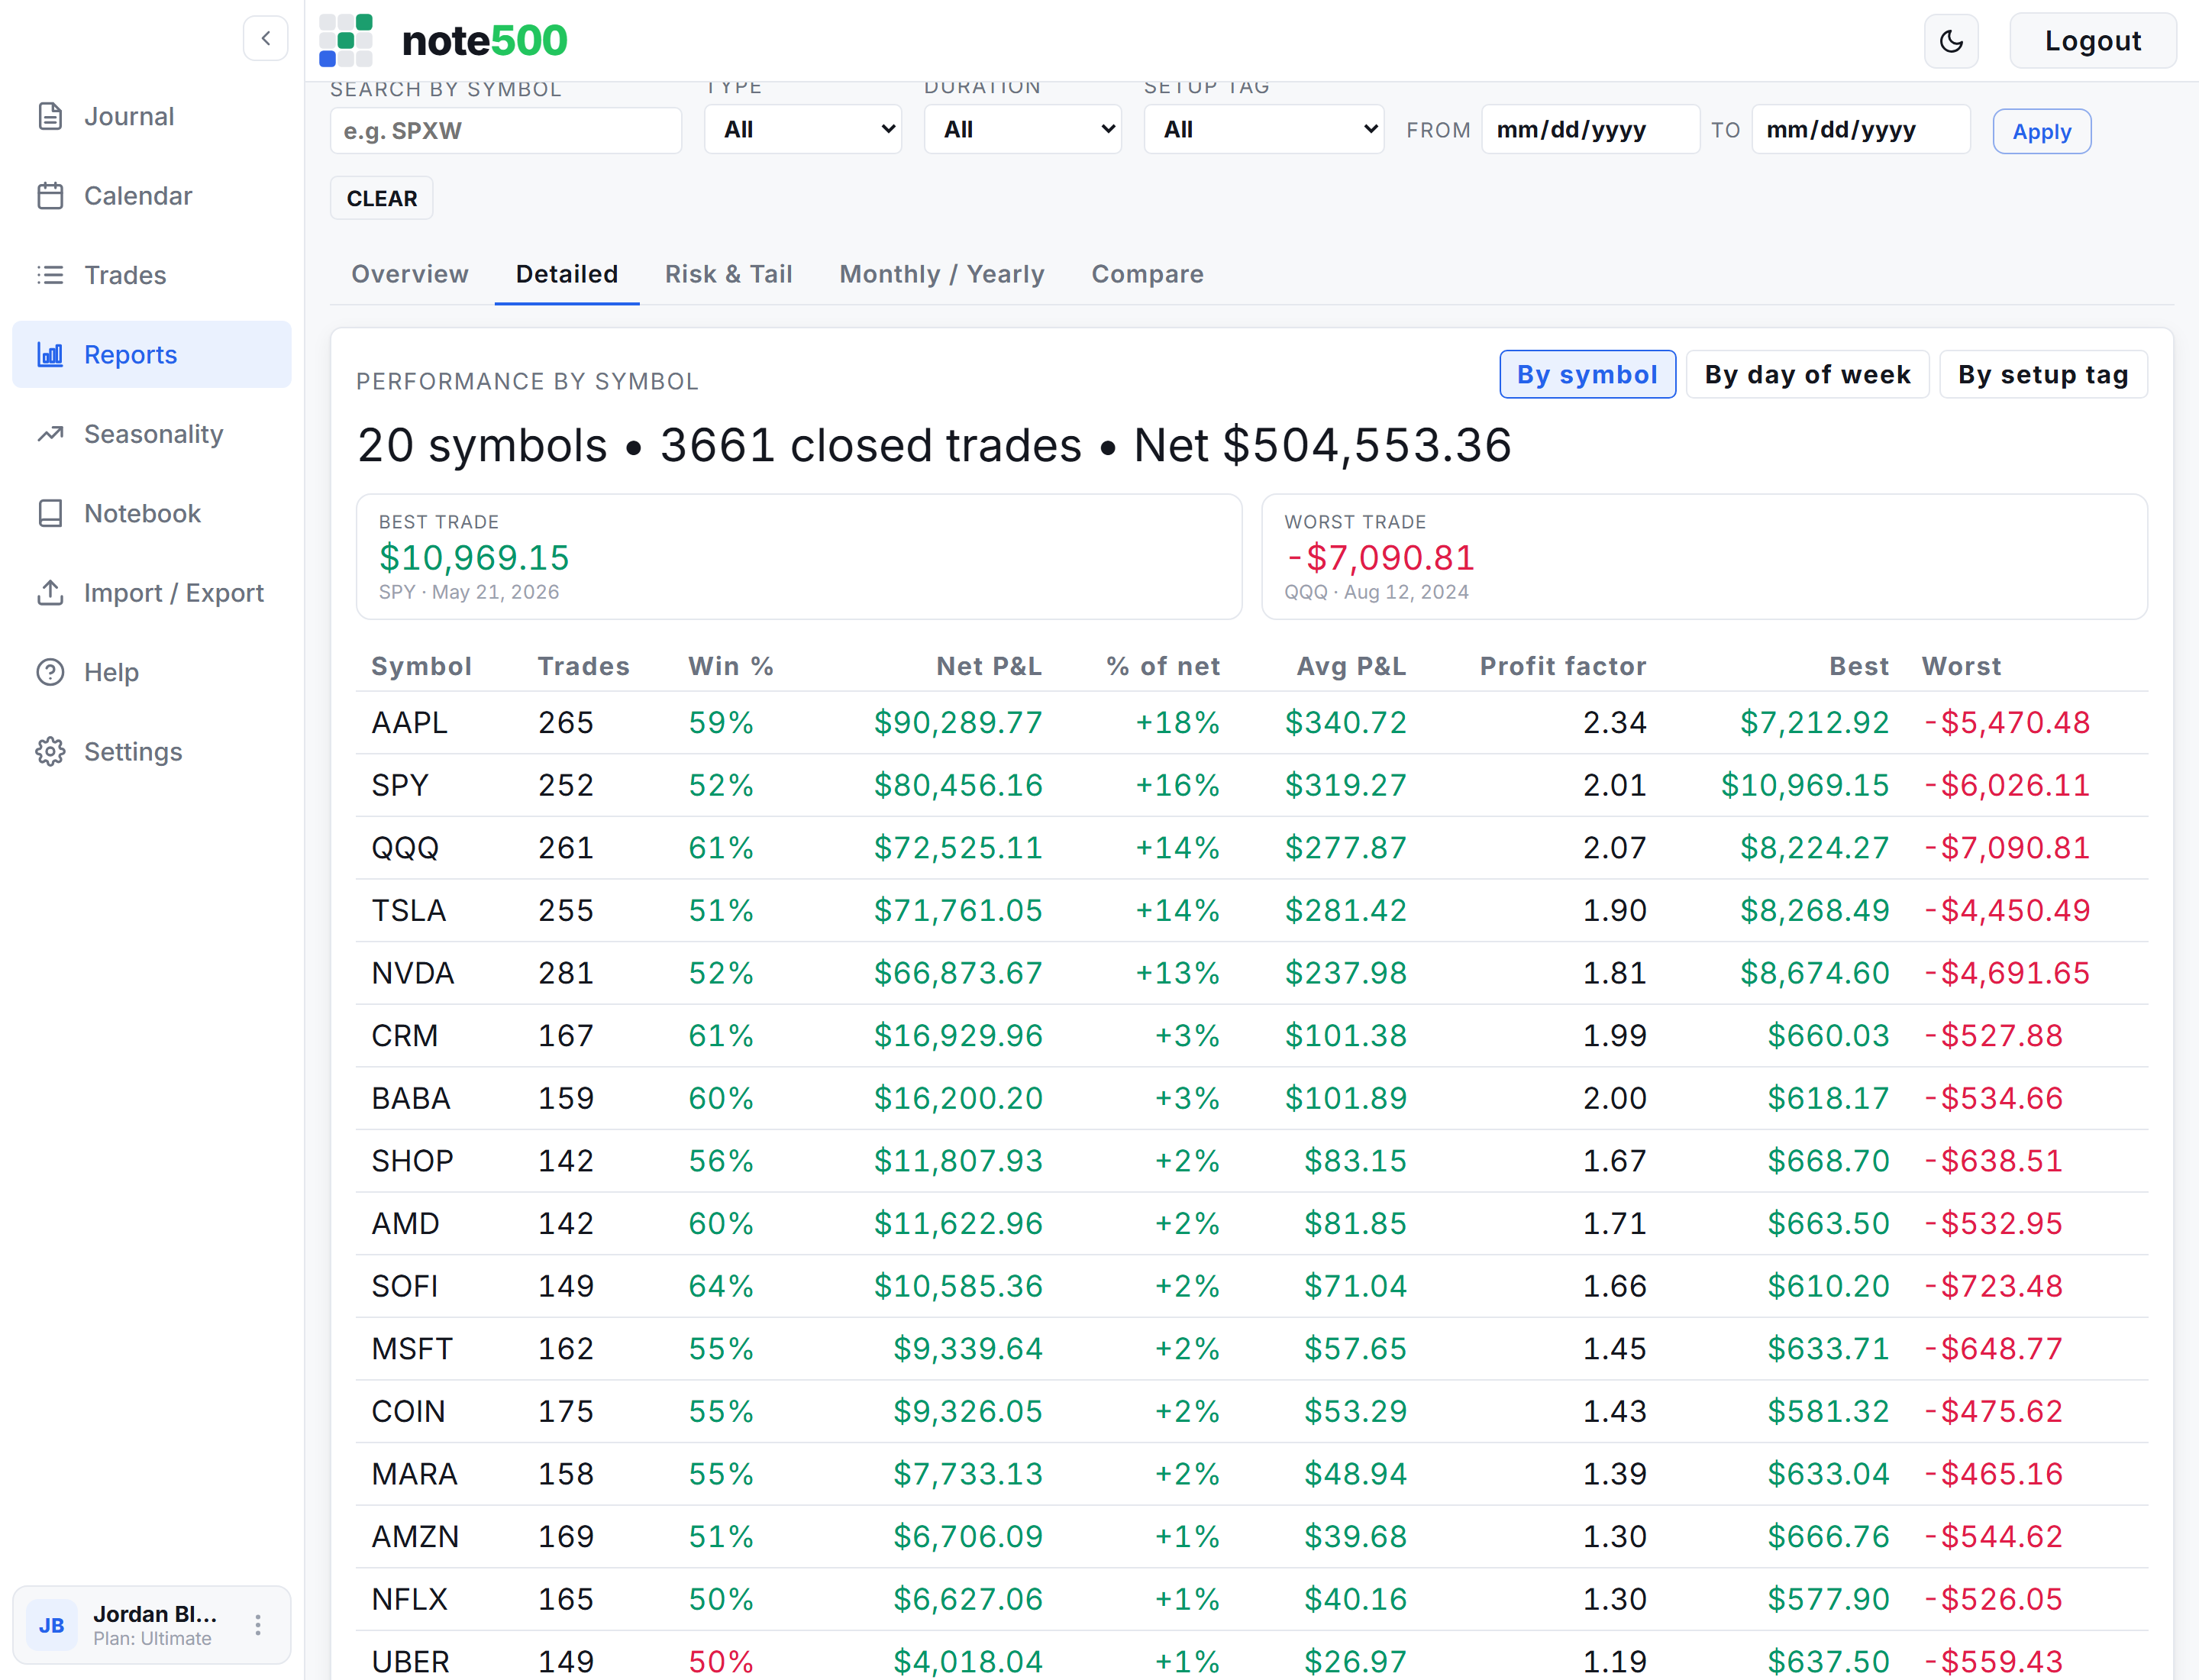
Performance broken down by symbol, setup tag and day-of-week — with concentration, per-group win rate and profit factor, and your best and worst trades called out.
Risk & Tail
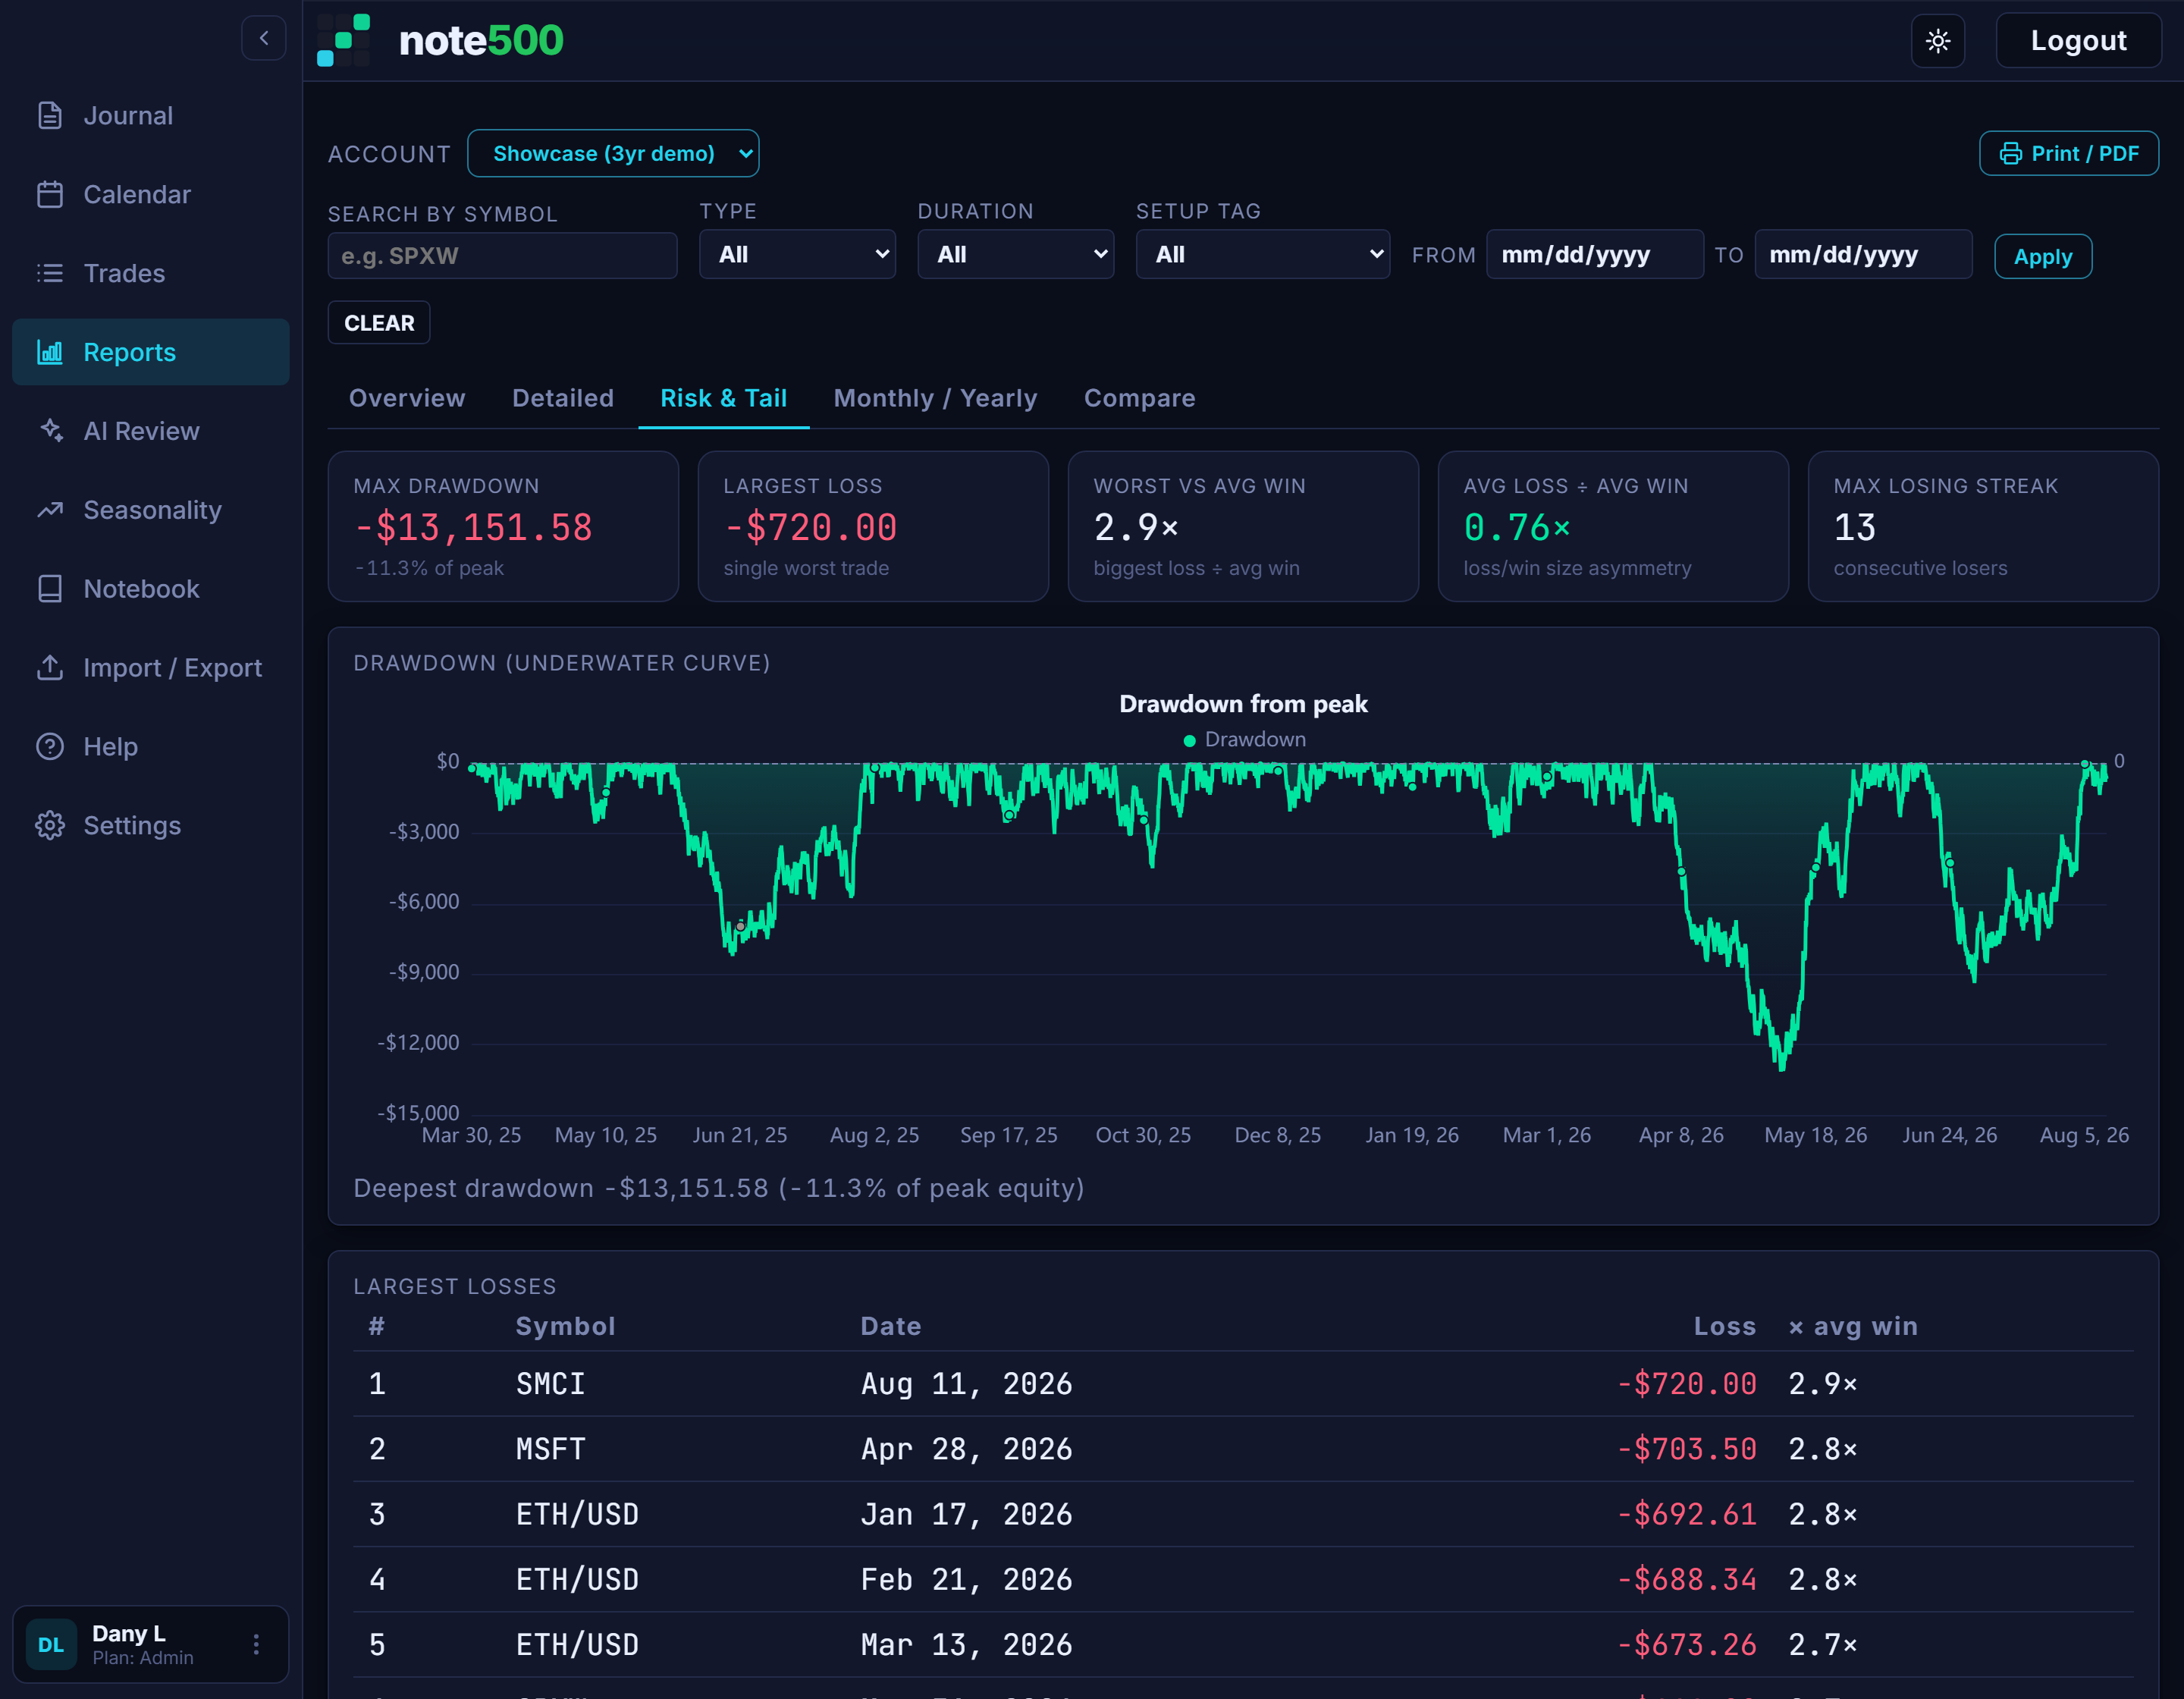
Max drawdown, worst losing streak, loss-vs-win asymmetry, an underwater drawdown-from-peak curve, and a ranked list of your ten biggest losses.
Monthly / Yearly
P&L, win rate and best/worst per month and per year, with a running balance — so you can see the shape of your year, not just today.
The metrics, in full
No paywalled "advanced" tier hiding the numbers that matter — the Reports suite ships the whole toolkit:
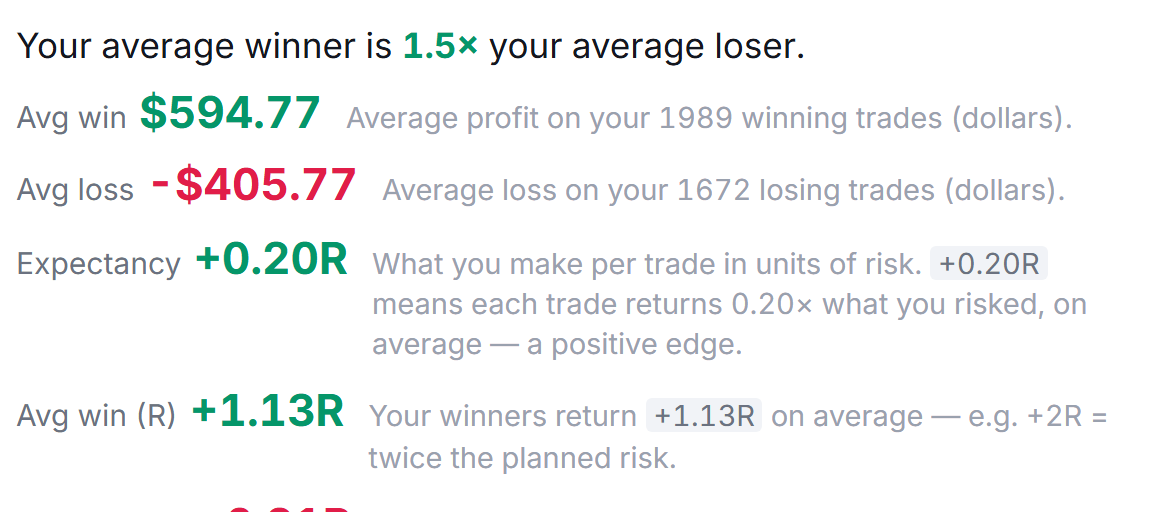
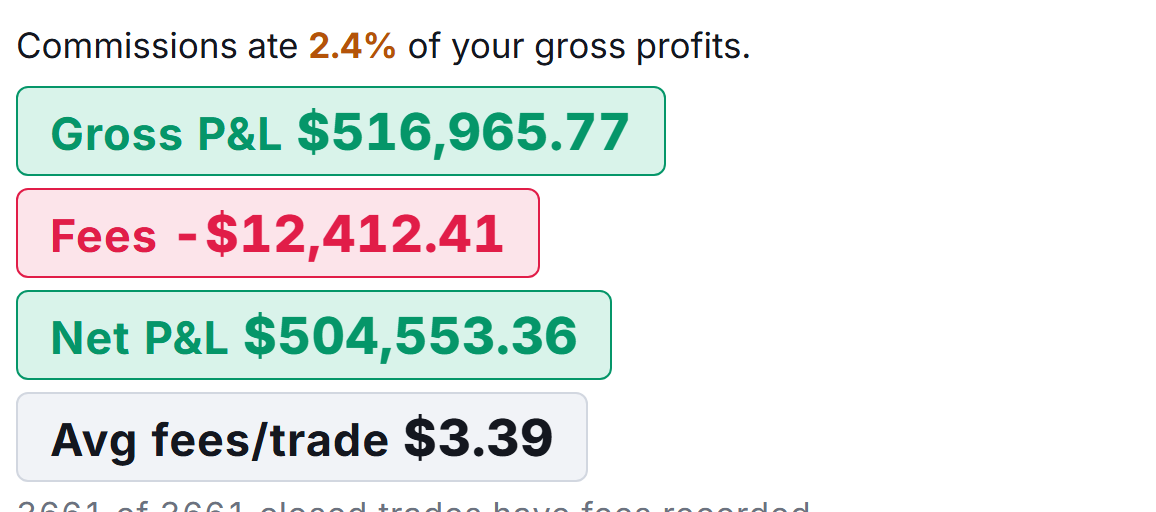
- The essentials — win rate, profit factor, expectancy, average win / average loss, payoff ratio, gross profit & loss, largest gain & loss, win / loss streaks.
- Risk — max drawdown, an underwater drawdown curve, loss-vs-win asymmetry, and Sharpe & Sortino ratios (per-trade, risk-free rate 0).
- R-multiples — a full R-multiple distribution and your expectancy expressed in R, once you record risk on your trades.
- Behavioural cuts — a time-of-day heatmap (hour × weekday), hold-time analysis, and scaling / partial-exit breakdowns.
- MAE / MFE & efficiency — how much you left on the table, and your trade-efficiency percentage.
Print it. Prove it.
Every report prints straight to PDF — for your own records, a trading coach, or a prop-firm evaluation that wants to see your numbers. And because your data is always yours, you can export the underlying trades to CSV, JSON or Excel on any plan, including free.
Fair on the free plan, too
The free plan isn't a dead end: the Overview report — the equity curve, win rate, profit factor, expectancy and the full report-statistics table above — is free on every plan, alongside the Macro Edge report. The deeper sub-tabs (Detailed, Risk & Tail and Monthly/Yearly) come with Plus and Ultimate. Pair it with the Tilt Detector and AI review and the numbers stop being a scoreboard and start being a coach.
See your real numbers →The Overview report is free on every plan; the deeper Reports sub-tabs (Detailed, Risk & Tail, Monthly/Yearly) are on note500's Plus and Ultimate plans — see pricing. R-multiple, MAE/MFE and risk-based charts depend on recording risk/stop data on your trades and show a prompt until you do.