Does losing make you trade worse? Measure it.
Every trader suspects they revenge-trade after a bad run. Almost none can prove it. note500's Tilt Detector settles it with your own numbers: it lines up how you trade after 0, 1, 2 and 3+ straight losses — and if the wheels come off after two, it tells you, and tells you to walk away.
Try note500 free →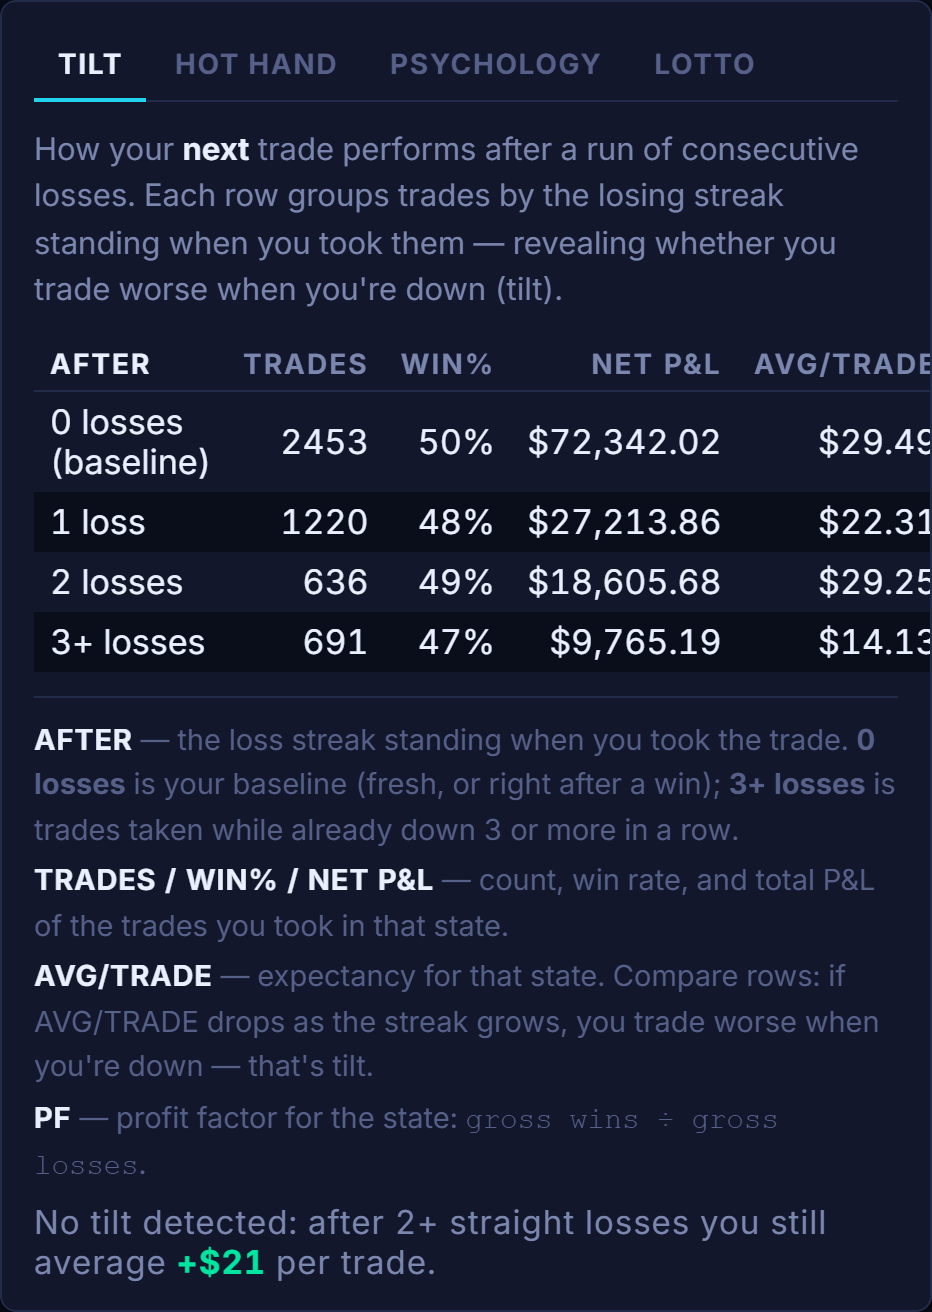
How it works
note500 walks your trades in order and tags each one with the losing streak it was taken into — a win or break-even resets the count. Then it buckets them and computes the numbers that matter for each bucket:
| Loss streak before trade | Win rate | Avg / trade | Profit factor |
|---|---|---|---|
| 0 — baseline | 58% | +$92 | 1.9 |
| 1 loss | 51% | +$40 | 1.3 |
| 2 losses | 39% | −$61 | 0.7 |
| 3+ losses | 31% | −$118 | 0.5 |
Illustrative example — your table is built from your own closed trades.
Read down that column and the story is unmistakable: a solid, profitable baseline that decays into a losing machine once two reds stack up. That's tilt, in numbers you can't argue with.
It gives you a verdict, not just a table
note500 compares your baseline — trades with no streak behind them — against your trades taken after two or more straight losses. If that after-losses average is negative, it names it plainly:
If there's no meaningful drop-off, it says so — "no tilt detected" — and if you haven't traded enough losing streaks yet for a read, it tells you that too, rather than inventing a pattern from three trades.
From a hunch to a rule
The whole point is a decision you can actually act on. A vague "I should probably stop when I'm frustrated" becomes a concrete "stop after two losses" — backed by your own expectancy, sitting in a discipline panel that also tracks your daily loss-limit rule, your clean-streak count, and your rolling win rate. The Tilt Detector finds the leak; the discipline panel helps you plug it.
Part of a fuller psychology read
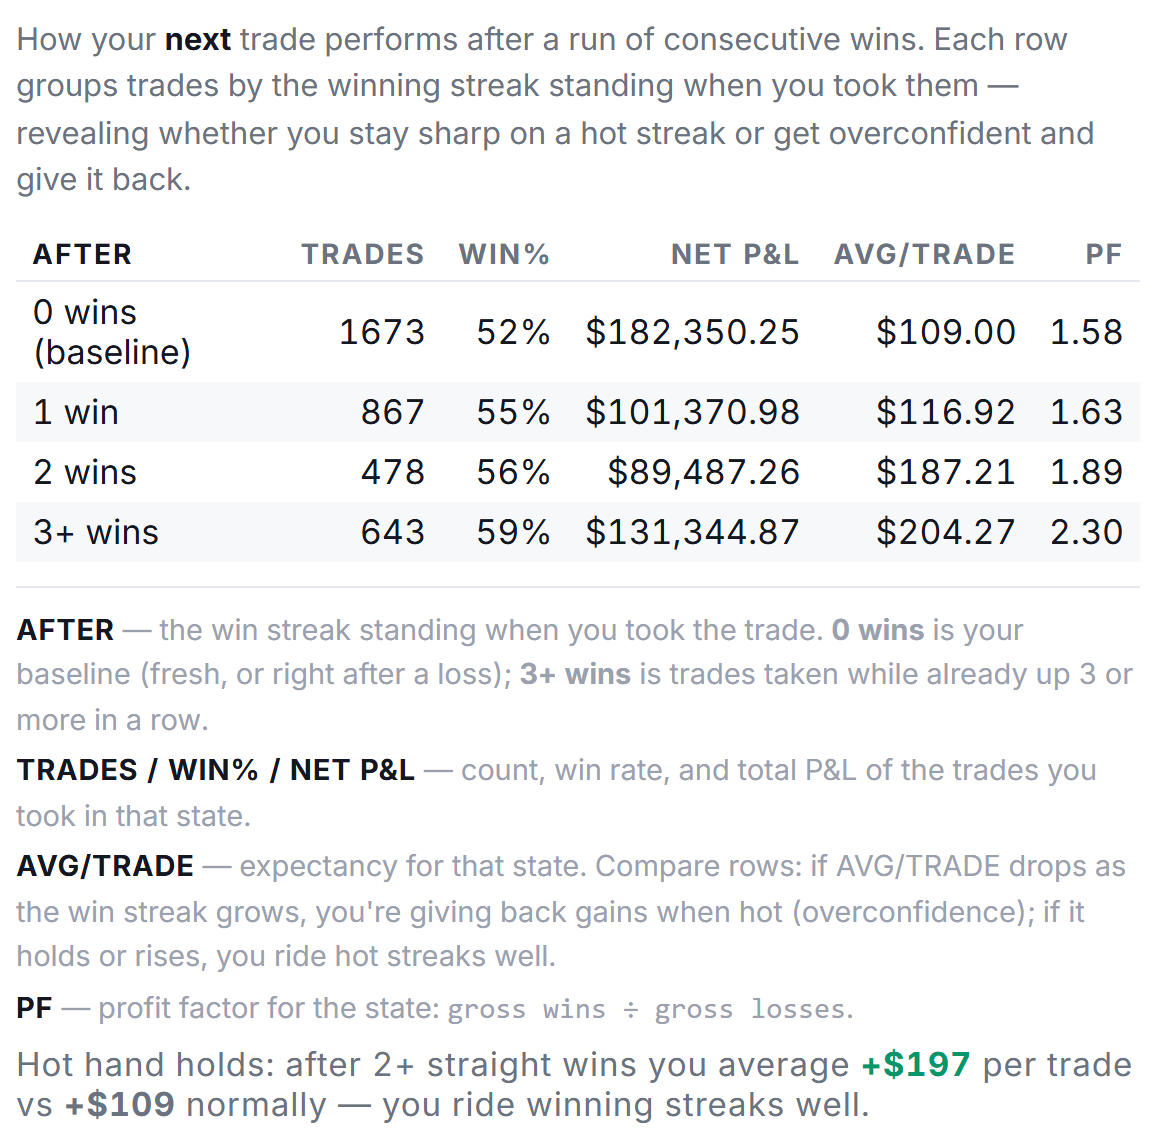
Tilt is one lens. Alongside it, note500 measures the mirror image — how you trade after wins (the hot-hand check), how your tagged emotions line up with results, and how much your fees quietly drag on the bottom line. And your AI trade review folds all of it into a plain-English coaching note with one thing to try next.
The Tilt Detector and the rest of note500's psychology and discipline stats are included on the paid plans (Plus and Ultimate) — see pricing. It's a reflection tool, not financial advice.