The one thing no other trading journal has: market seasonality
Every journal tells you what you did. note500 also tells you what the market tends to do from here — built from about 100 years of S&P 500 history — and, with Compare, lays your own trades on top of it. So the question "is this month usually like this?" finally has an answer.
Try note500 free →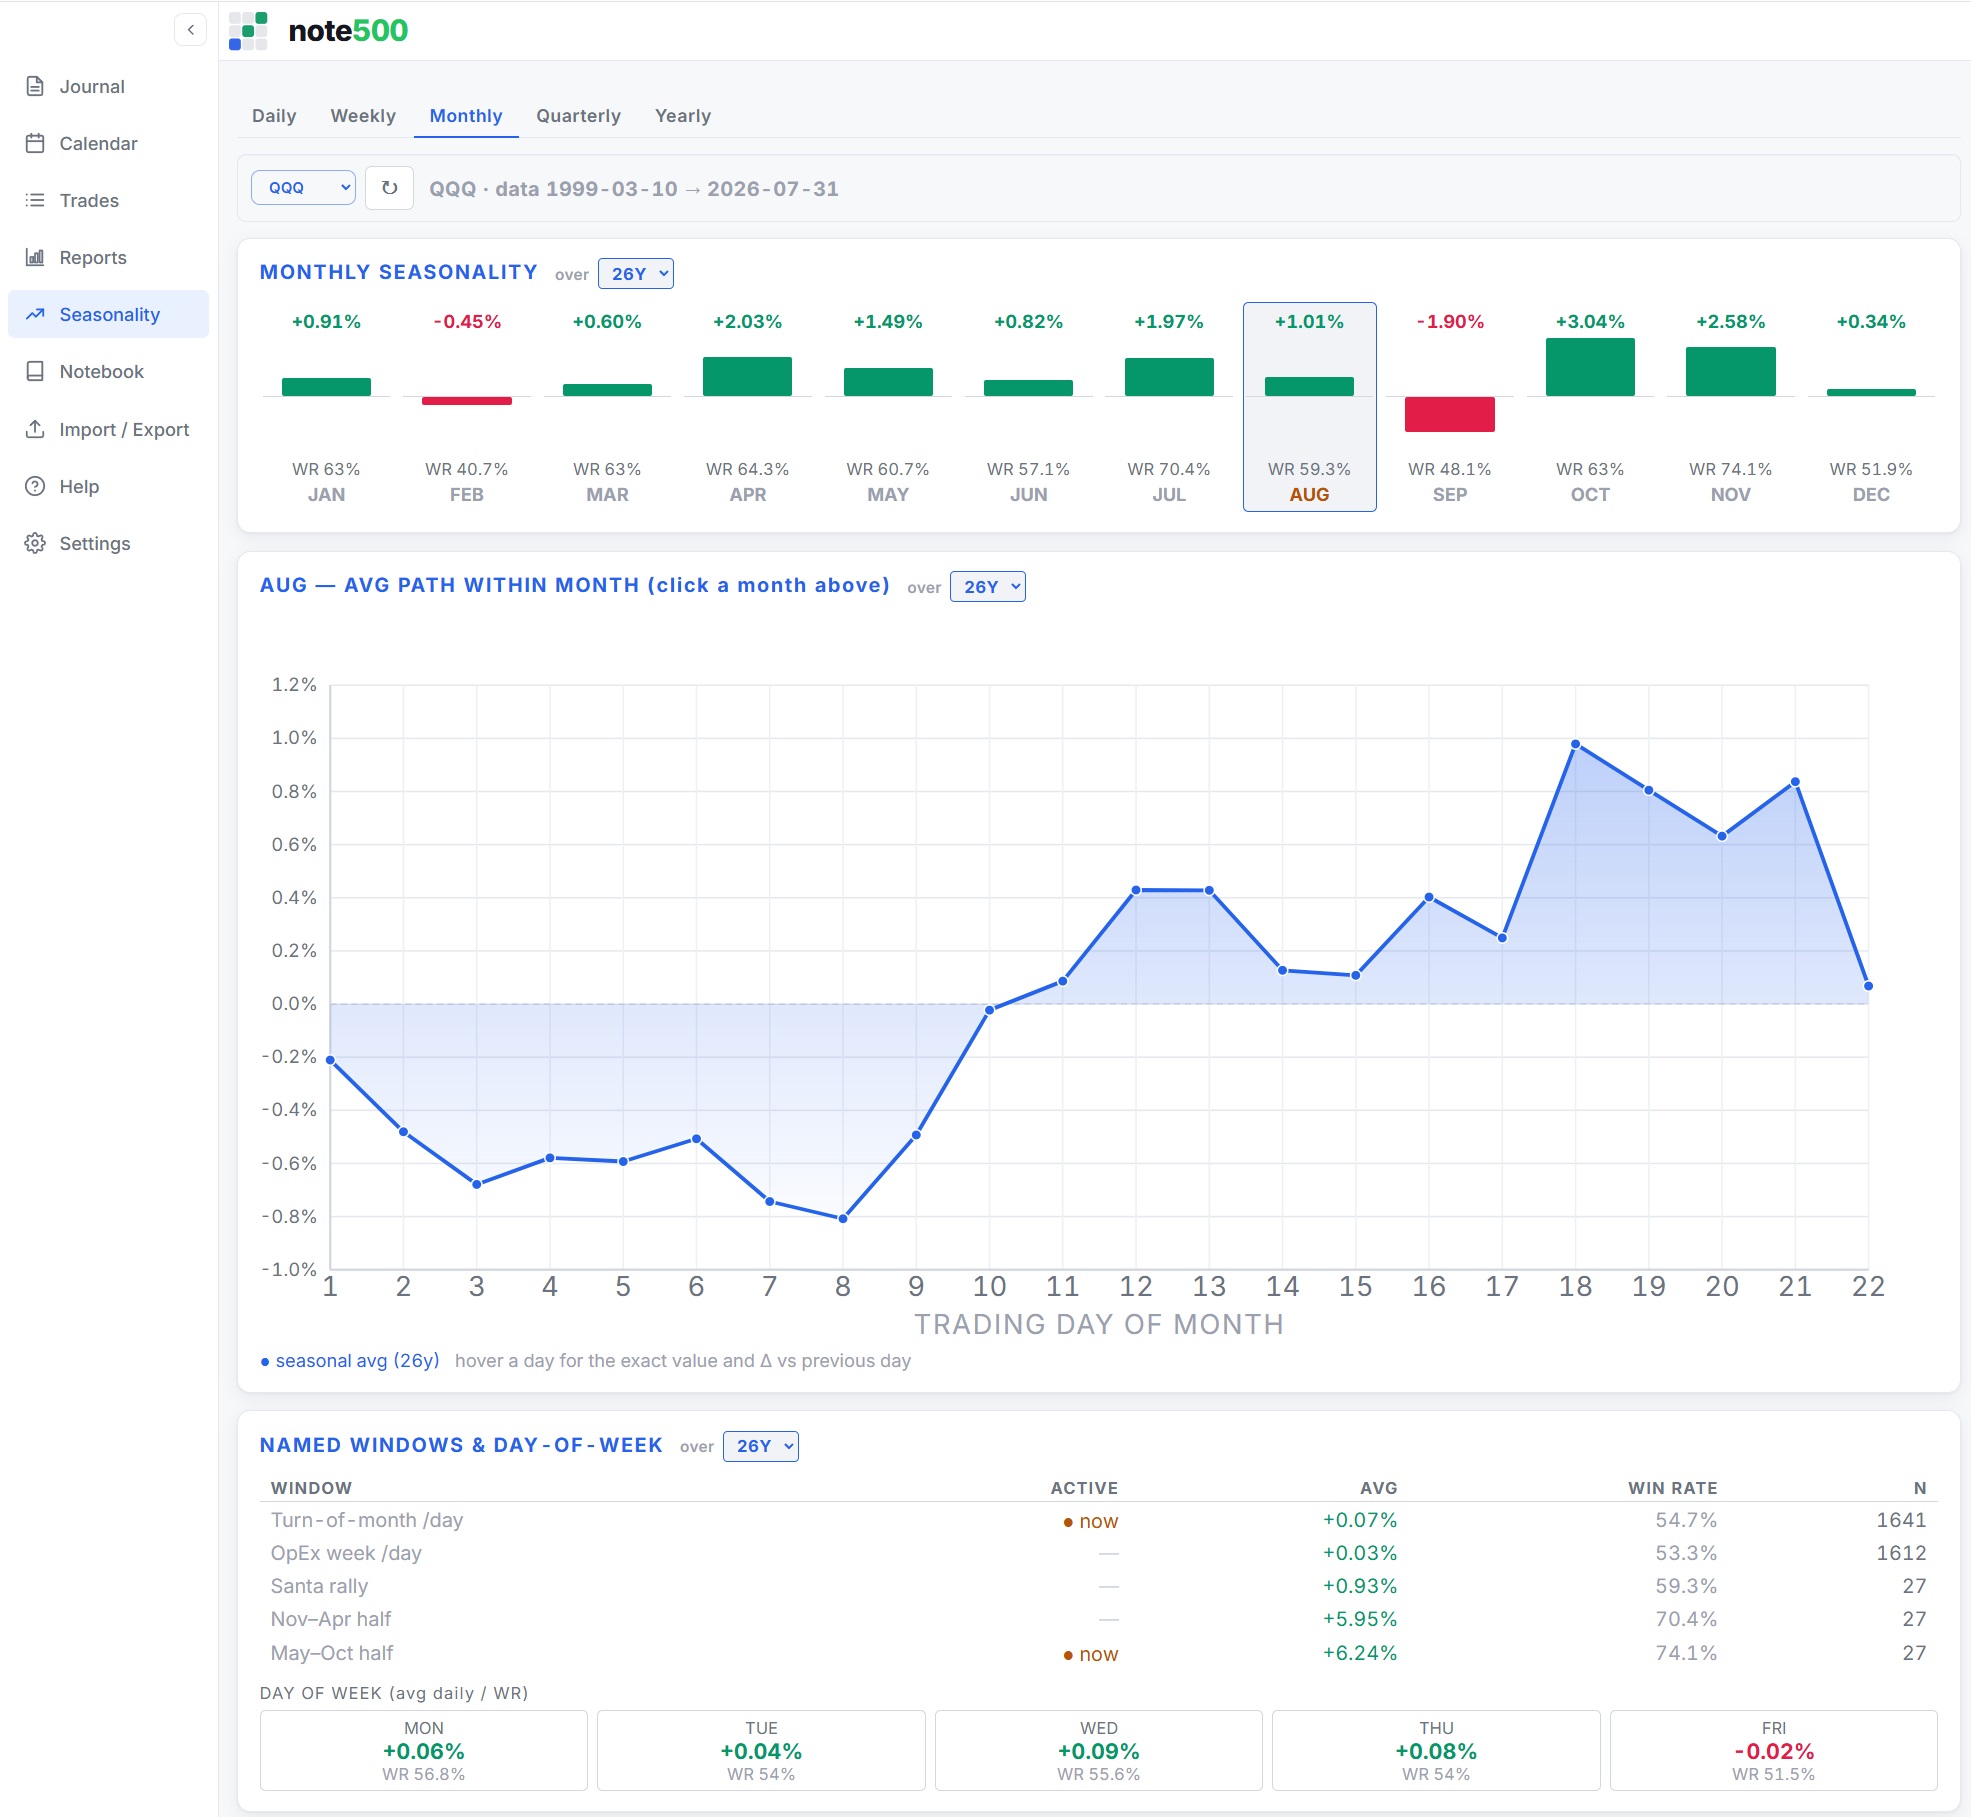
What seasonality answers
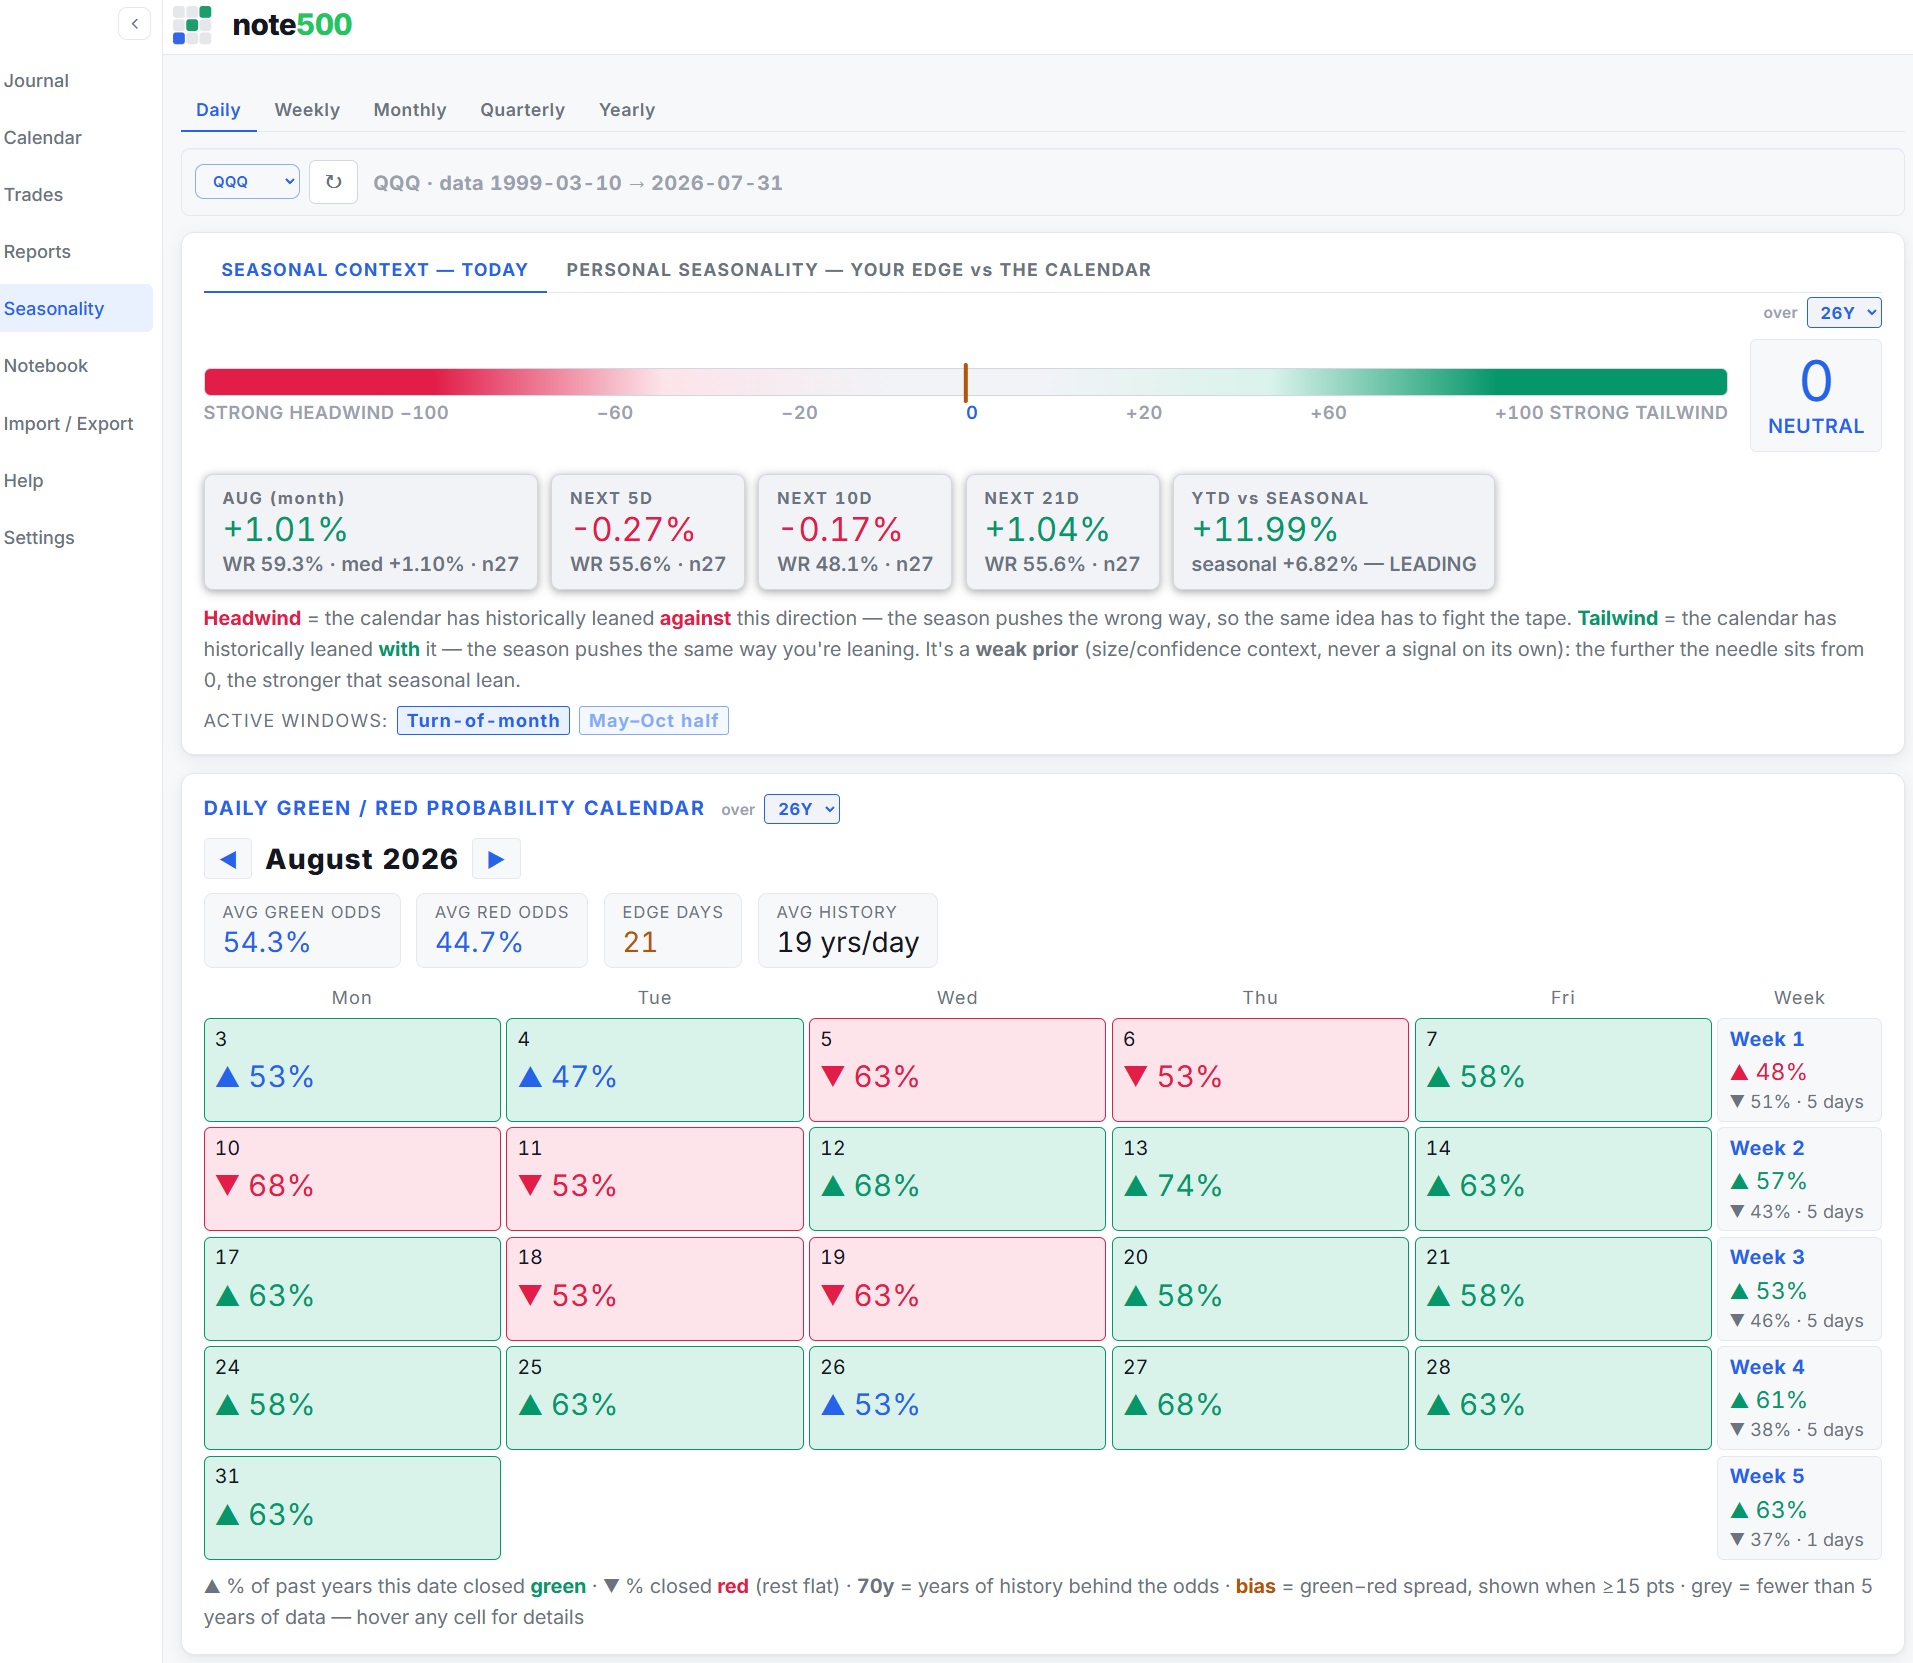
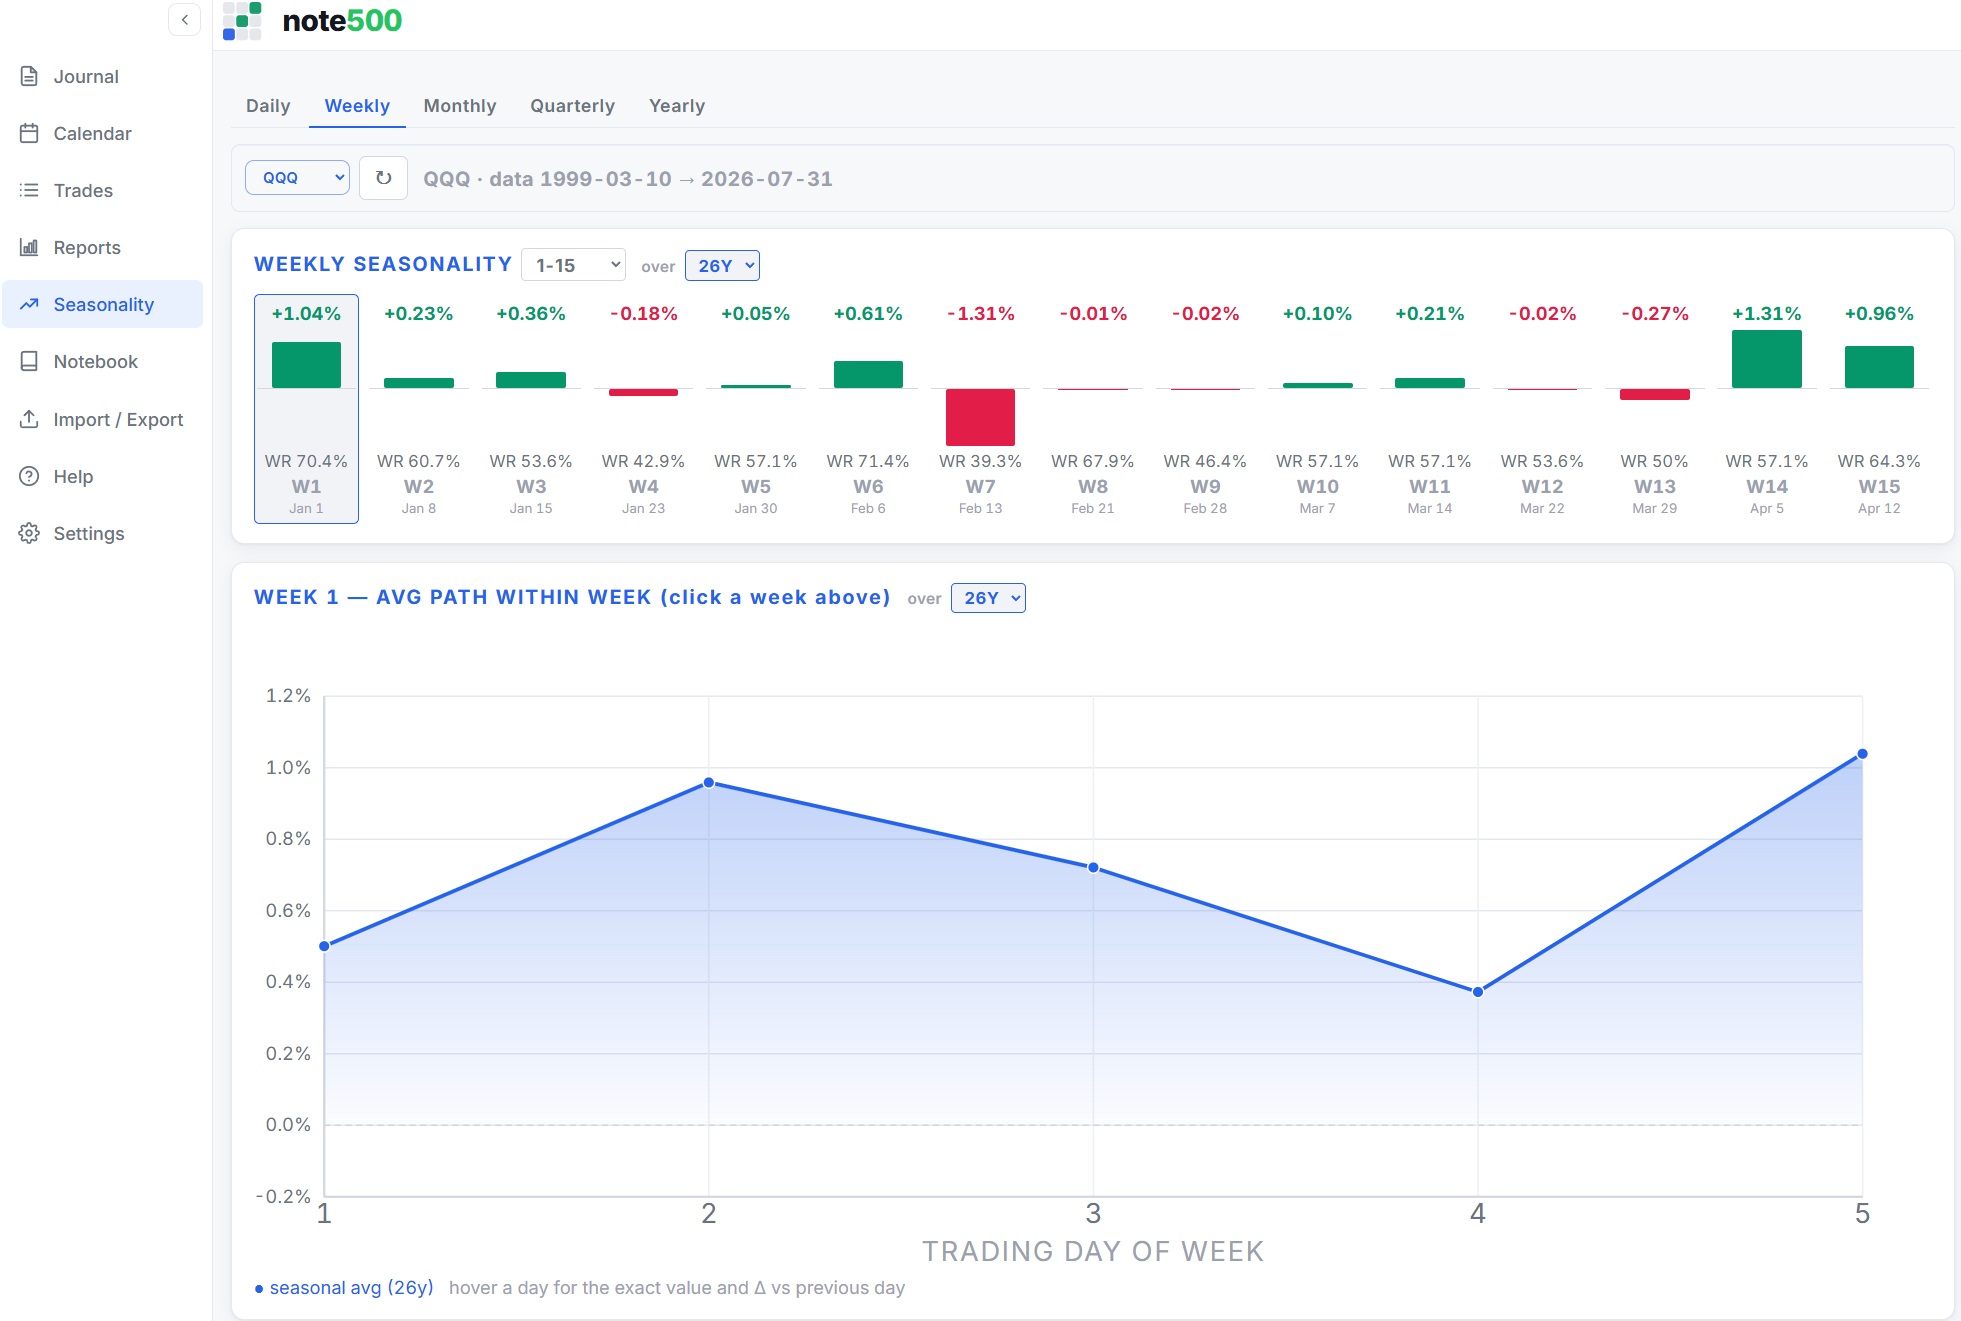
Given the calendar alone, what has the S&P 500 historically done from exactly where we are today? note500 turns decades of daily index history into four plain-English reads:
- Monthly bias — the average and median return for each calendar month, with the win rate (share of positive months) and the best/worst year on record. The current month is highlighted.
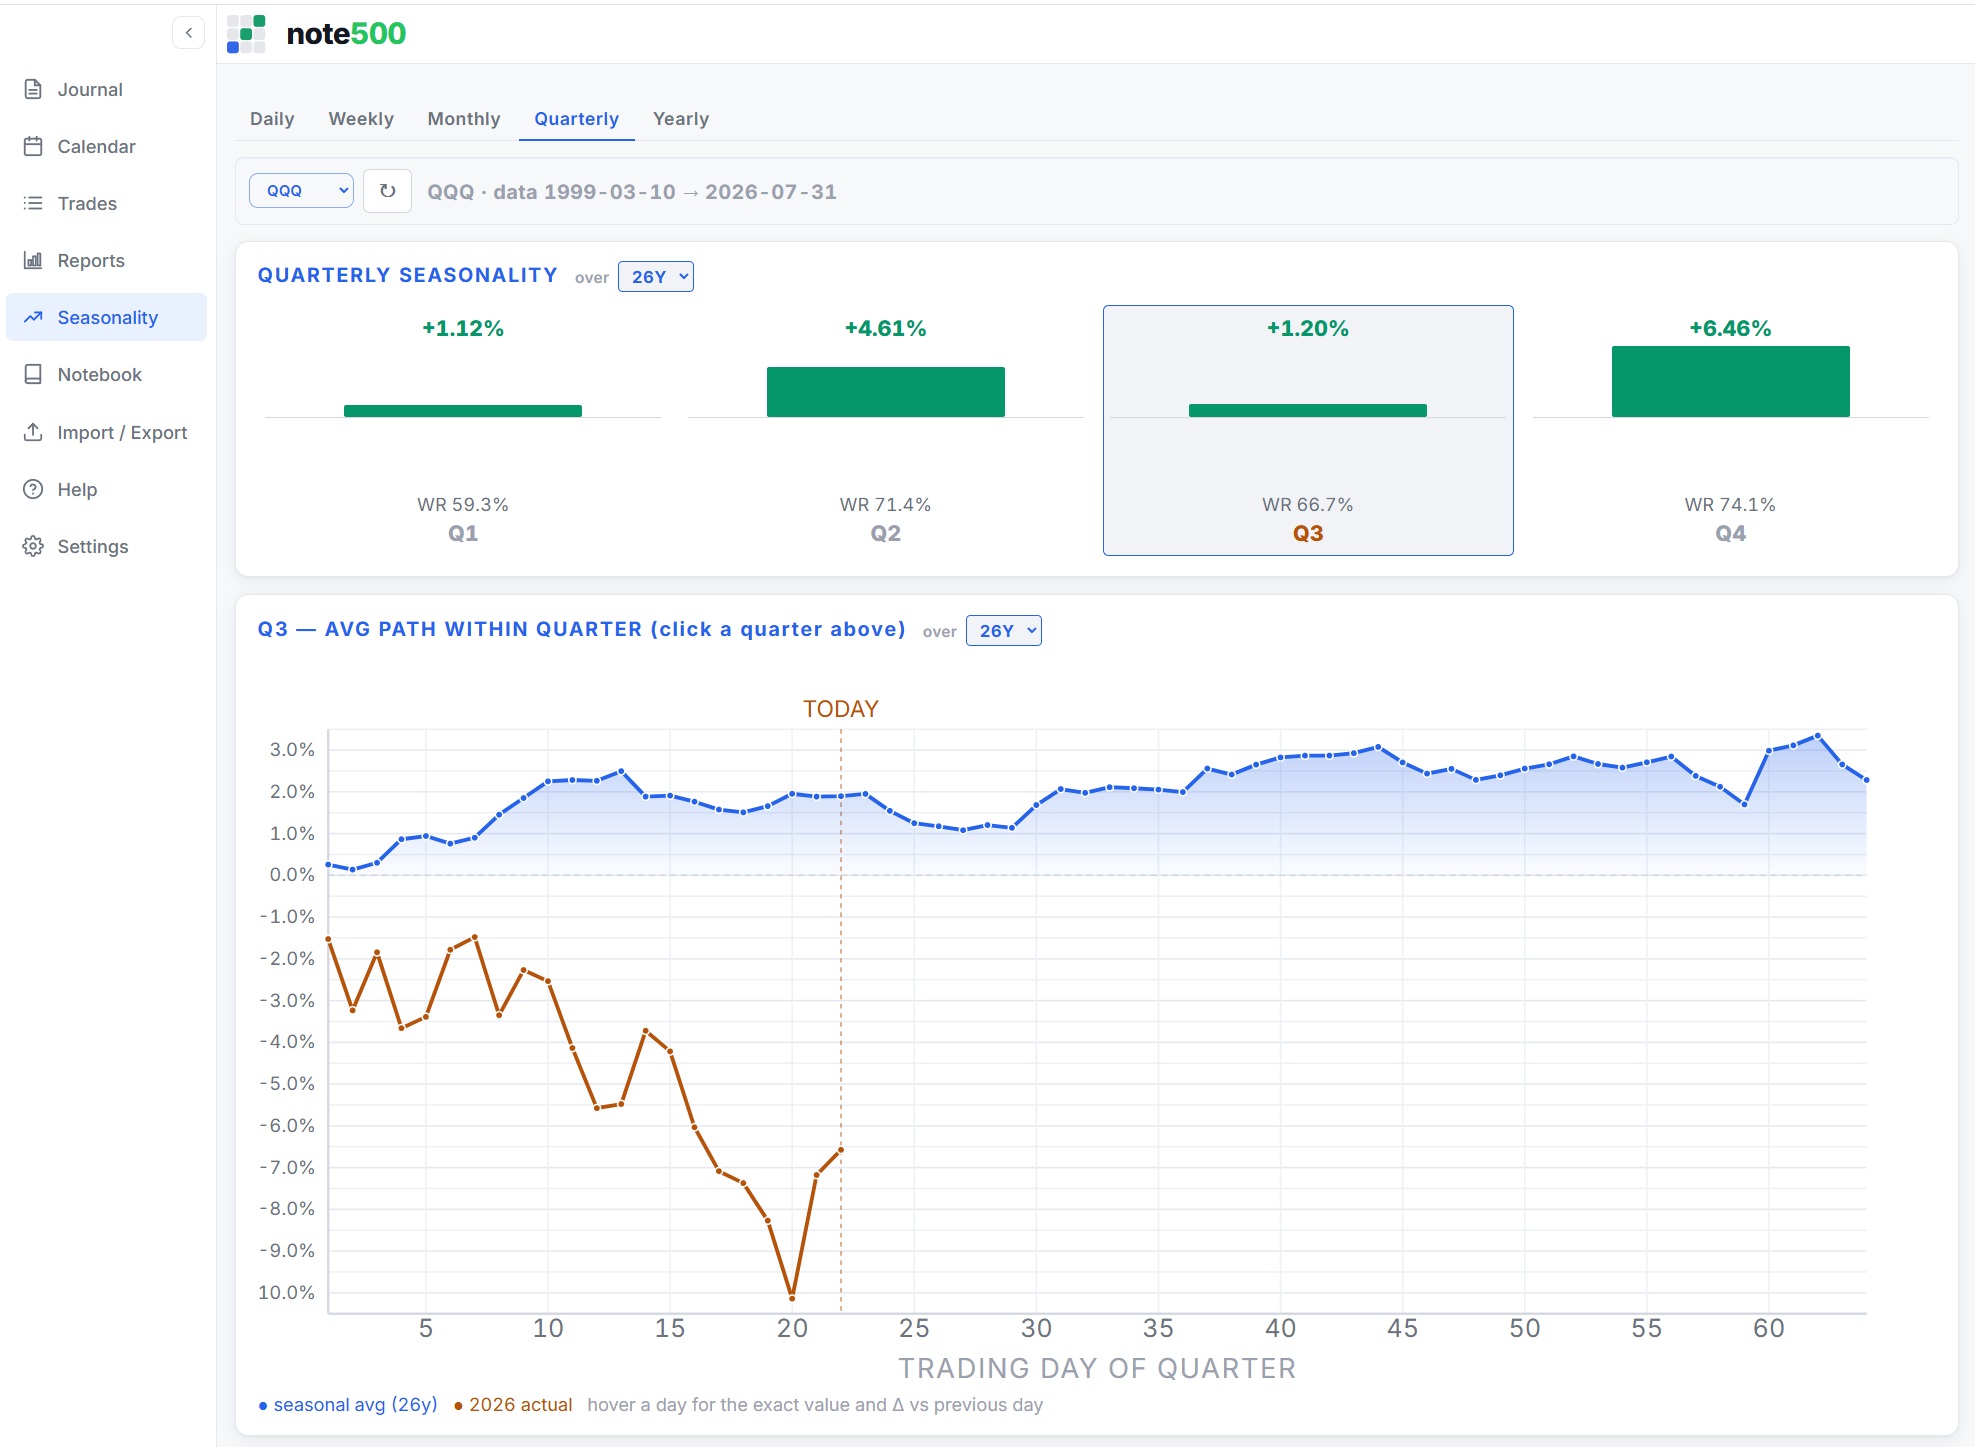
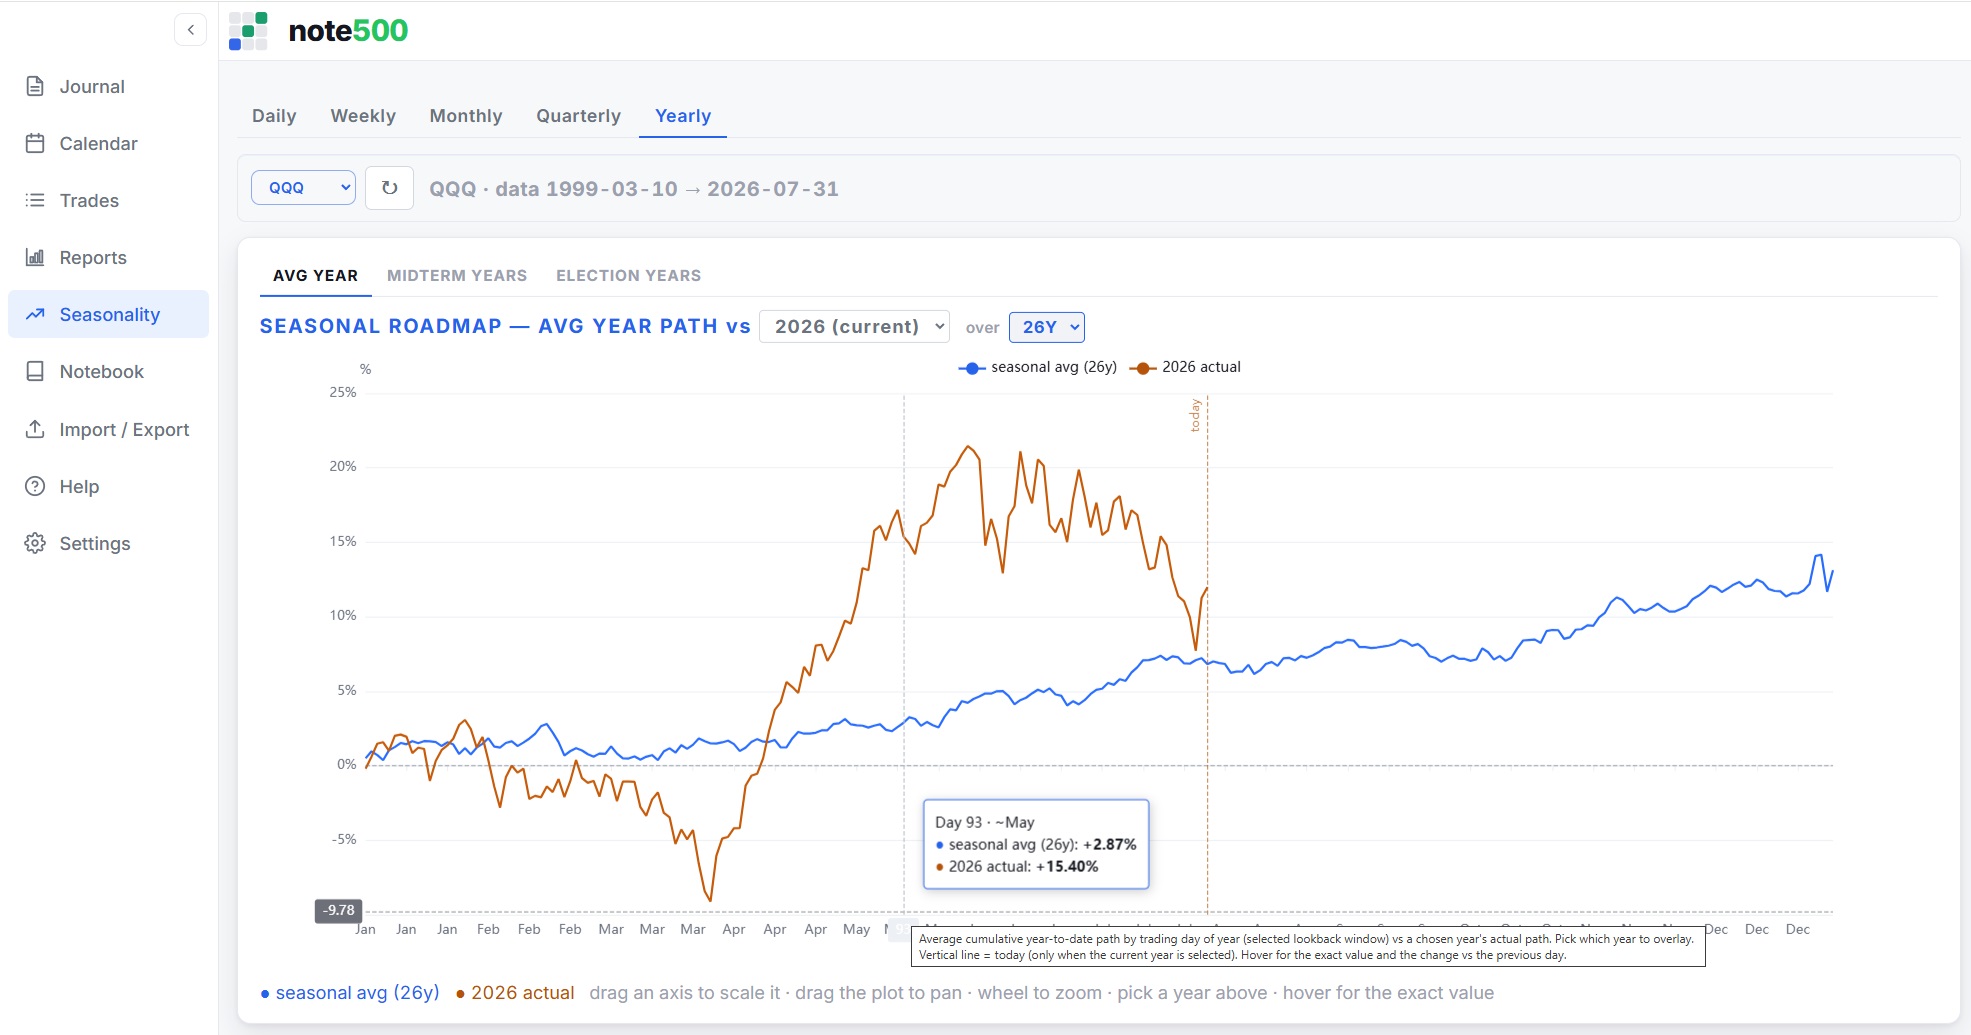
- The seasonal roadmap — the average year-path traced day by day, with the current year's actual path overlaid and a "you are here" marker. Instantly shows whether the tape is tracking, leading or fighting its usual script.
- Forward expectations — from today's calendar position, the average return, win rate and worst case over the next 5, 10 and 21 trading days. The single most actionable number on the page.
- Named windows — turn-of-month, OpEx week, the Santa rally and the "Sell in May" halves, each flagged when it's active now, with its own average and win rate.
Compare: your trades against the calendar
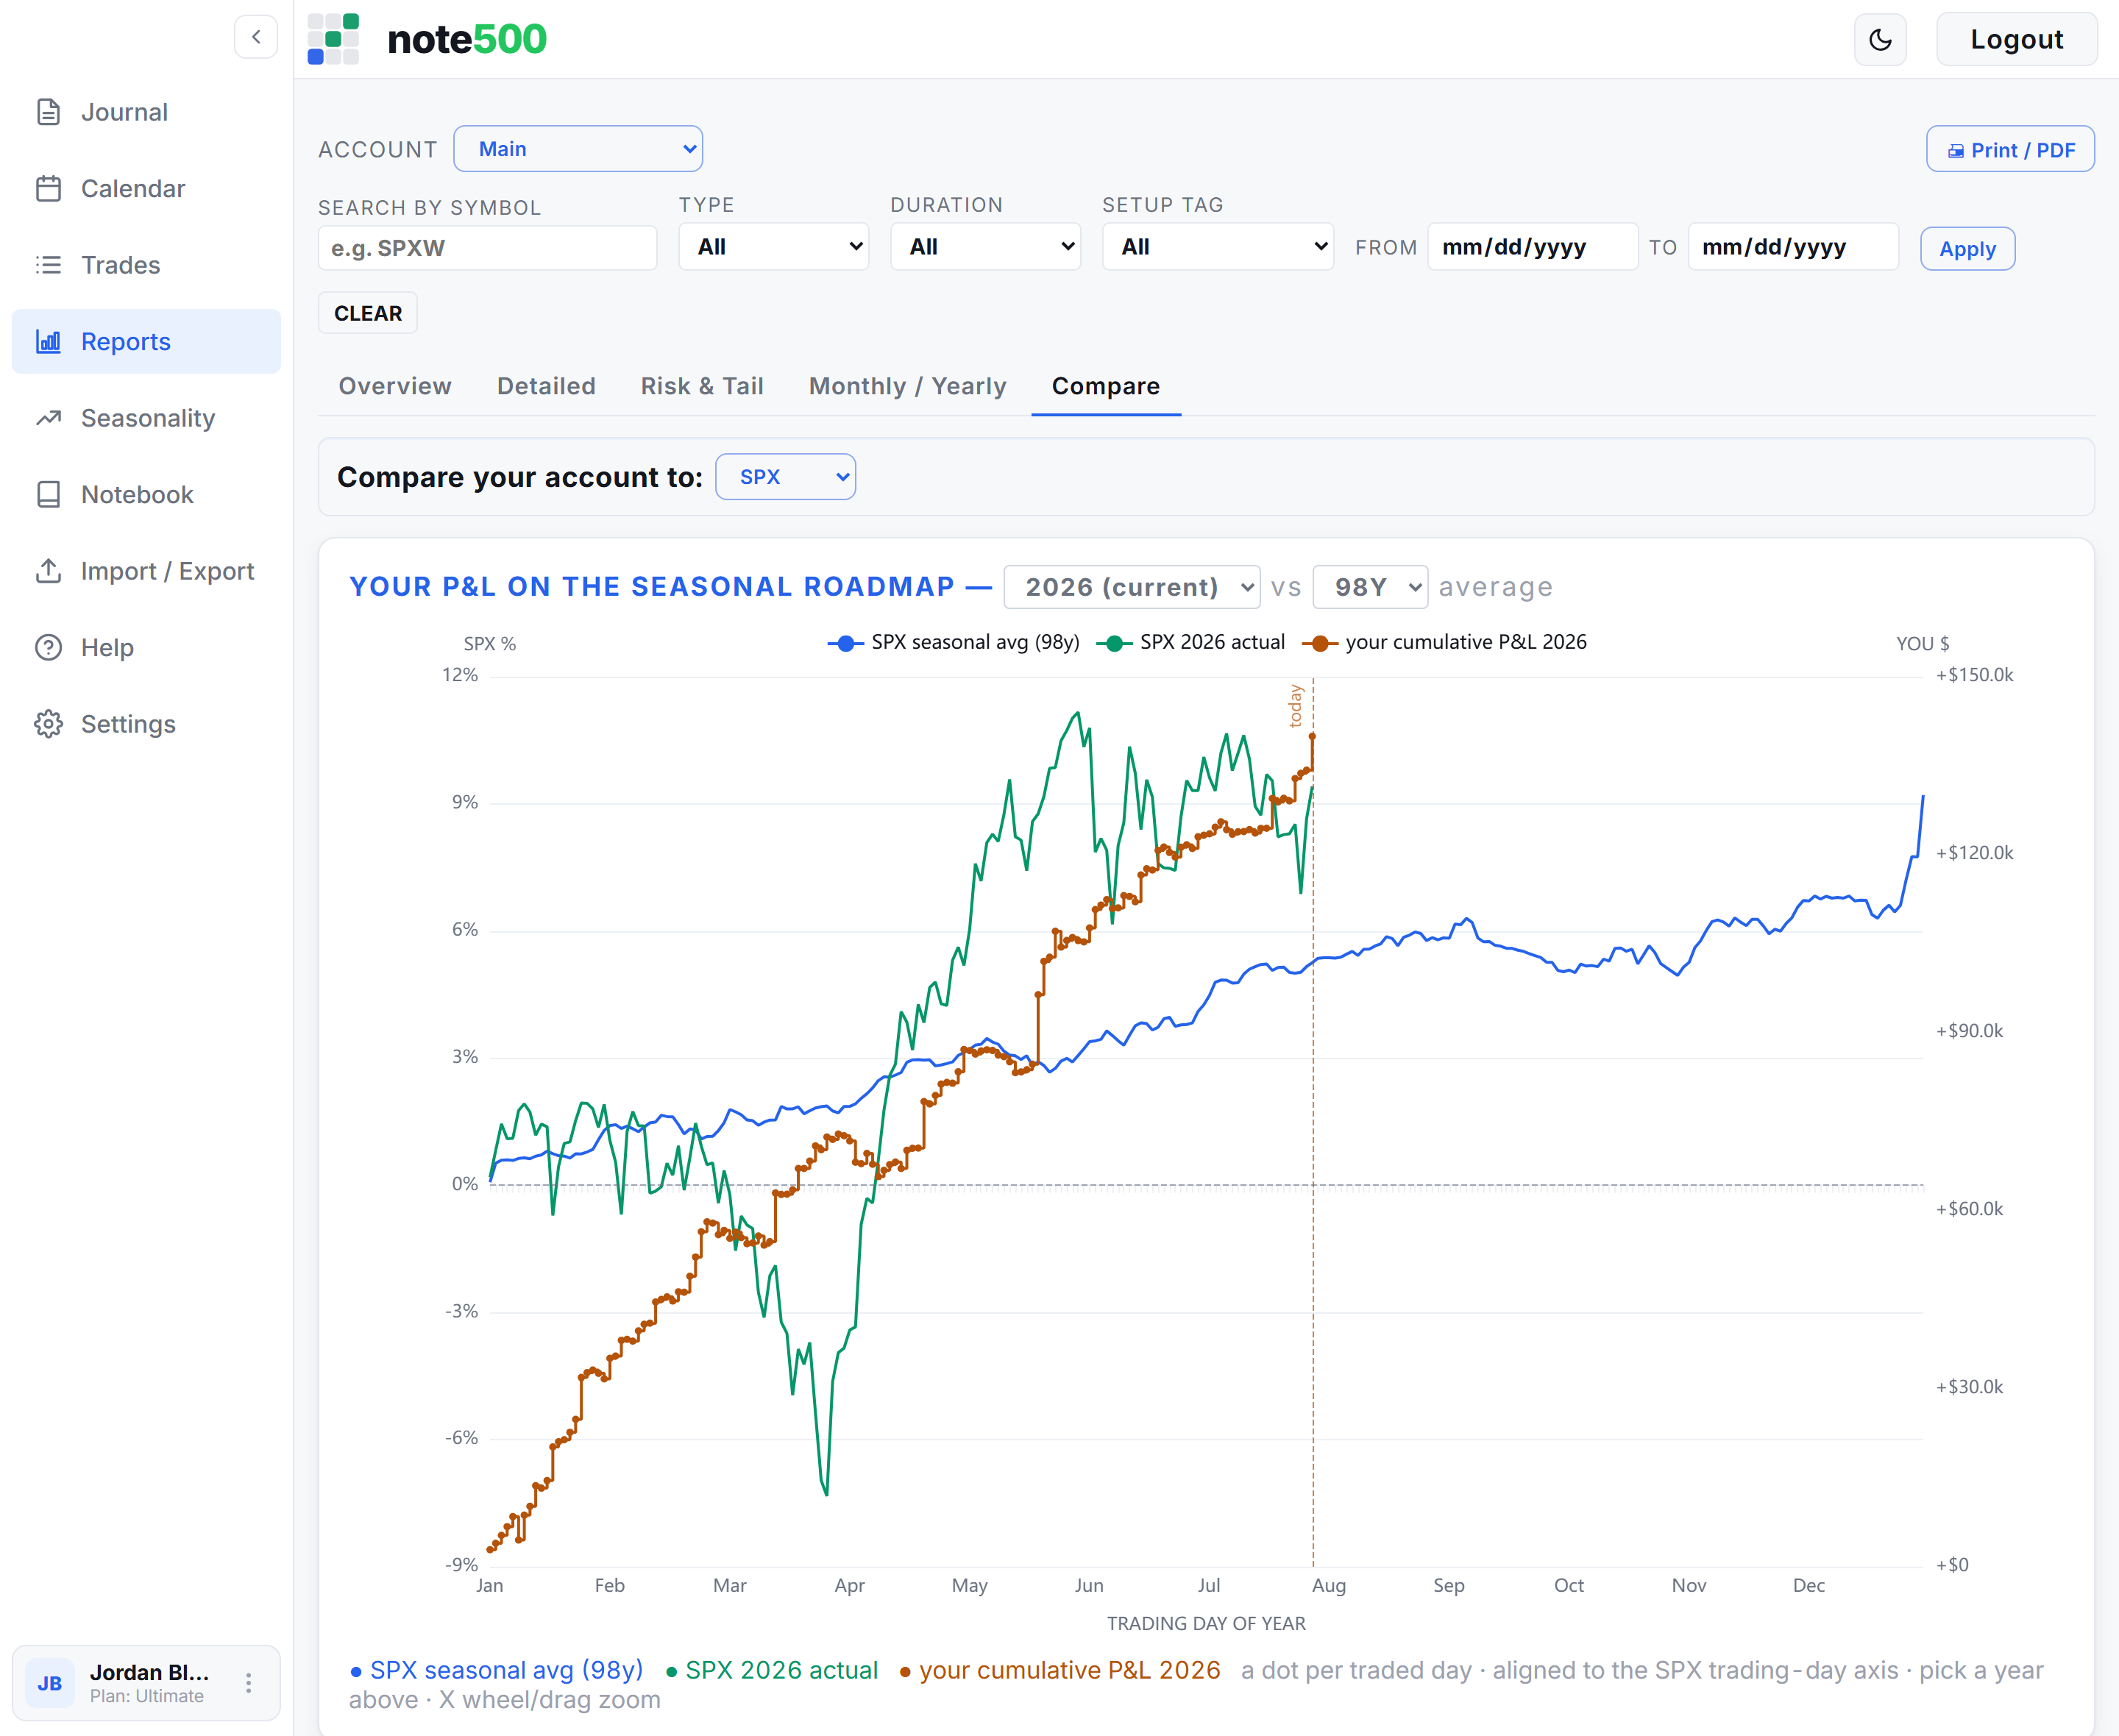
This is where seasonality stops being trivia. Compare overlays your own results on the seasonal picture, so you can see the thing that's invisible in a plain journal: do you trade better or worse when the calendar is a tailwind versus a headwind? Some traders discover their edge lives almost entirely in strong-seasonality windows; others find they force trades in the flat, chop-prone stretches. Either way, it's a pattern you can only see when your P&L and the market's history sit on the same chart.
How the numbers are built
- ~100 years of data. S&P 500 daily history goes back to 1927 — roughly 25,000 completed sessions. DJI, NDX and QQQ are covered too.
- Choose your lookback. View tendencies over 10, 20 or 30 years, or the full history — the whole page re-reads instantly.
- Every stat carries its sample size. Seasonal averages are drawn from a few dozen samples with real variance, so note500 shows the median next to the average, leads with the win rate, prints the sample count on everything, and greys out anything too thin to trust.
- Lookahead-free. Only completed sessions count — today's partial bar is dropped — and every path is indexed by trading day, not calendar day, so holidays never skew the curves.
Why it's not on other journals
Building this means maintaining a century of clean index history, trading-day-aligned math, and a way to cross it with each user's trades — work most journals skip because they treat "journal" as a record of the past, not a lens on the present. That's the bet note500 makes: your results are more useful next to the market's own tendencies. As of 2026, no other mainstream trading journal ships this.
See your trades against ~100 years of market history →Seasonality and Compare are included on every note500 paid plan (Plus and Ultimate) — see pricing. Historical market tendencies are not predictions; past performance does not guarantee future results.